


TORONTO, May 5, 2021 /PRNewswire/ - Golden Star Resources Ltd. (NYSE American: GSS) (TSX: GSC) (GSE: GSR) ("Golden Star" or the "Company") reports its financial and operational results for the first quarter ended March 31, 2021. All references herein to "$" are to United States dollars.
Q1 2021 HIGHLIGHTS:
- Q1 2021 production totaled 40.1 thousand ounces ("koz") from Wassa, in line with Q1 2020 and Q4 2020 performance. The All-In Sustaining Cost ("AISC") for the period of $1,100 per ounce ("/oz") was slightly higher than expected as sales lagged production by 3%.
- Mining rates of 4,499 tonnes per day ("tpd") were in line with guidance and the 3.0 grams per tonne ("g/t") grade was in line with the reserve grade.
- Q1 2021 saw continued investment in infill drilling and development at Wassa, ahead of future production expansion as described in the new technical report on Wassa filed on March 1, 2021 (the "Wassa Technical Report"). Q1 2021 investing activities totaled $12.8 million ("m").
- Cash increased by $5.2m in Q1 2021 to total $66.1m, with net debt reducing in Q1 2021 by $3.9m to $39.5m.
- The Wassa Technical report demonstrated the significant growth potential at Wassa by outlining a mineral reserve plan with a six-year mine life and average annual production of 177koz of gold at an AISC of $881/oz (excluding corporate costs). The preliminary economic assessment ("PEA") of the potential expansion of the Southern Extension zone in the Wassa underground mine ("Wassa Underground") outlined a further 11-year life extension, average annual production of 294koz and an AISC of $778/oz (excluding corporate costs).
- In-mine exploration drilling conducted during Q1 2021 continued to deliver positive results adjacent to the current and planned reserve mining areas. These intercepts demonstrate the potential to increase the size of the Wassa ore body with extensions to the main B-Shoot, the hanging wall zone and new foot wall targets.
Table 1 – Q1 2021Performance Summary (Continuing Operations unless otherwise stated)
|
1. See "Non-GAAP Financial Measures" |
Q1 2021 |
Q1 2020 |
%change |
|
|
Production - Wassa |
Koz |
40.1 |
40.3 |
(1)% |
|
Production – Prestea (discontinued operation) |
Koz |
- |
9.6 |
(100)% |
|
Total gold produced |
Koz |
40.1 |
50.0 |
(20)% |
|
Gold sold - Wassa |
Koz |
38.9 |
36.5 |
7% |
|
Gold sold - Prestea (discontinued operation) |
Koz |
- |
9.1 |
(100)% |
|
Total gold sold |
Koz |
38.9 |
45.6 |
(15)% |
|
Average realized gold price (inc. Deferred Revenue) |
$/oz |
1,669 |
1,481 |
17% |
|
Cash operating cost per ounce - Wassa1 |
$/oz |
718 |
632 |
14% |
|
Cash operating cost per ounce - Prestea1 |
$/oz |
- |
1,778 |
(100)% |
|
Cash operating cost per ounce - Consolidated1 |
$/oz |
718 |
860 |
(17)% |
|
All-in sustaining cost per ounce - Wassa1 |
$/oz |
1,100 |
952 |
16% |
|
All-in sustaining cost per ounce - Prestea1 |
$/oz |
- |
2,172 |
(100)% |
|
All-in sustaining cost per ounce - Consolidated1 |
$/oz |
1,100 |
1,201 |
(8)% |
|
Gold revenues |
$m |
65.0 |
54.1 |
20% |
|
Adj. EBITDA1 |
$m |
27.2 |
21.2 |
28% |
|
Adj. income/(loss)/share attributable to shareholders - basic1 |
$/share |
0.04 |
0.02 |
100% |
|
Cash provided by operations before working capital |
$m |
23.3 |
17.1 |
36% |
|
Changes in working capital and taxes paid |
$m |
(13.0) |
(9.6) |
(36)% |
|
Net cash used in investing activities |
$m |
(12.8) |
(12.4) |
3% |
|
Net cash provided by financing activities |
$m |
7.7 |
0.1 |
7,600% |
|
Free cash flow 1 |
$m |
(2.5) |
(4.9) |
49% |
|
Cash |
$m |
66.1 |
41.9 |
58% |
|
Net Debt |
$m |
39.5 |
63.4 |
38% |
Andrew Wray, Chief Executive Officer of Golden Star, commented:
"Q1 2021 was a steady quarter with the mining rate at approximately 4,500tpd and the grade close to the reserve grade. The group cash position increased to $66.1m at the end of the quarter, as the operating cash flow together with $8.6m of net proceeds from the At The Market equity program during the quarter more than offset the payment of $13m of tax relating to Q4 2020 as well as the continued capital investment in the business. These funds will enable the continued investment in growth and exploration and also leave us well positioned to meet our obligations relating to the convertible debenture as they reach maturity in August 2021.
The highlight of the quarter was the release of the Wassa Technical Report that demonstrates a robust reserve mine plan followed by production set out in the PEA which identified the potential for significant growth of the Wassa operation to a rate of approximately 300koz each year. We look forward to updating the market on the infill drilling program and optimization studies as these progress. These initiatives will unlock the delivery of the Wassa expansion and identify further opportunities to improve the economics and lessen the environmental impact of the mine in the future.
Our 2021 guidance remains unchanged, production of 165-175koz is expected to be delivered at an AISC of $1,000-1,075/oz. That implies a slight increase in the quarterly production rate for the balance of 2021, which is expected to result from an increase in grades. This also assumes that the paste plant is fully commissioned over the next three months as we address some inconsistencies in paste strength results from the test stope. We continue to see this year as one focused on increasing investment in development and drilling activities in order to support further volume increases which are anticipated in turn to provide production growth and enhanced cash flow generation.
The increased budget that was allocated to exploration in 2021 is already starting to identify opportunities for expansion of the Wassa underground resource. The continued success of the in-mine drilling program is identifying additional mineralization around existing and planned reserve infrastructure. This continued success could see a reallocation of elements of the exploration budget to allow for further drilling of these in-mine targets with the ambition of accelerating the process for resource inclusion."
Q1 2021 RESULTS WEBCAST AND CONFERENCE CALL
The Company will conduct a Q1 2021 results conference call and webcast on Thursday May 6, 2021 at 10.00 am ET.Toll Free (North America): +1 888 390 0546
Toronto Local and International: +1 416 764 8688
Toll Free (UK): 0800 652 2435
Conference ID: 10172867
Webcast: https://produceredition.webcasts.com/starthere.jsp?ei=1457692&tp_key=dbcf14841e Following the conference call, a recording will be available on the Company's website at: www.gsr.com.
KEY EVENTS – Q1 2021
Wassa Operational Performance and Infrastructure Investment
- Throughout Q1 2021, the mining rate averaged 4,499tpd, representing a 4% increase on the 4,324tpd achieved in Q1 2020 and 8% higher than the 4,175tpd achieved in Q4 2020.
- Underground mined grade averaged 3.0g/t, broadly in line with the updated underground reserve grade of 3.1g/t (announced on March 1, 2021).
- Processing of low-grade stockpiles continued during Q1 2021, given the continued strength of the gold price. This initiative, which utilizes latent capacity in our process plant without compromising gold recovery rates, contributes additional cash flow, albeit at a slightly higher AISC than achieved by the underground mine. This initiative contributed 3koz of production during Q1 2021.
- Investment in infrastructure continued throughout Q1 2021 to provide additional mining flexibility with the objective of increasing mining rates. Capital expenditure totaled $9.8m during Q1 2021.
- Paste fill plant commissioning continued during Q1 2021. Some commissioning delays were experienced during the quarter and although the plant is performing to design, some results from the quality assurance testing returned lower than expected fill strengths in the test stope, which is currently under investigation. Test work will continue into Q2 2021 and at this point in time any delay during the quarter is not expected to impact on the 2021 guidance. With secondary stopes planned in H2 2021, contingency plans are also being developed to help mitigate further delays to the filling schedule.
Wassa Technical Report
- On March 1, 2021, the Company filed the Wassa Technical Report which includes a mineral reserve and resource update and a PEA providing an assessment of the potential development of the southern extension of Wassa and the increase in mining rates to fully utilize the available process plant capacity.
- The mineral reserve plan outlines a six-year mine life with annual production averaging 177koz of gold at an AISC of $881/oz (excluding corporate costs), for a post-tax net present value ("NPV") of approximately $336m when using the consensus gold pricing and a discount rate of 5%. The post-tax NPV is $121m when using a base case of $1,300/oz gold price.
- The PEA represents a conservative plan that excludes exploration opportunities from its scope and adopts the current mining practices and equipment to deliver a robust economic outcome while minimizing execution risk. Opportunities to improve productivity and reduce the environmental impact of the operation through the application of technology will be evaluated in the next phase of work.
- The PEA outlines an 11-year mine life from the inferred mineral resource in the southern extension zone, with total gold production of 3.5 million ounces and average annual gold production of 294koz, representing an increase of approximately 75% on the current production rate at an AISC (excluding corporate costs) of $778/oz.
- Robust economics with a post-tax NPV at a discount rate of 5% of approximately $783 million and an internal rate of return of 53% at the consensus long term gold price per ounce ($1,585/oz). The post-tax NPV is $452m when using a base case of $1,300/oz gold price. These values are incremental to those in the reserve plan.
COVID-19 PANDEMIC
- During Q1 2021, our operations in Ghana experienced 29 suspected COVID-19 cases with 23 confirmed cases as at quarter end. The Company's in-house Polymerase Chain Reaction ("PCR") testing capability allows for rapid diagnosis and management response. This significantly reduced the number of people required to isolate as a result of contact tracing, supporting business continuity throughout the pandemic. As a major employer and therefore catalyst for rural economic stimulus in the host communities, we understand that our continuing operations are critical to the health and well-being of our workforce and the thousands of people that they support, both directly and indirectly. Given the relatively low number of confirmed and suspected COVID-19 cases, the operational impact to date has been limited. More information on our COVID-19 management controls can be found at www.gsr.com/responsibility/COVID-19
- Wassa Underground mine continued to operate through the challenges posed by the COVID-19 pandemic in Q1 2021. Access to site for the expatriate operators was possible throughout the quarter. The reducing COVID-19 case numbers in the UK allowed for more regular access to the operation for the corporate team towards the end of the quarter.
- On March 29, 2021, the Wassa medical team received their first vaccination against COVID-19, as part of the Ghana Health Services ("GHS") vaccination program. Following the GHS program for frontline workers, a further 635 members of the workforce and the remaining medical team members received their first COVID-19 vaccination in April 2021 as part of the wider Western Regional program roll out.
- Ghana continued to experience a decline in case rates in Q1 2021. The Ghana Health Services had reported 91,709 known cases of COVID-19, with 1,334 active cases at April 15, 2021. A total of 5,749 positive cases were confirmed in the Western Region, where the Wassa mine is located, of which 36 are active cases at April 15, 2021.
- Supply chains for the shipment of dore to the refinery and for the key consumables, including cyanide, lime, grinding media, fuel and lubricants, have remained intact throughout the pandemic. All supply chains are being continually monitored and alternative suppliers have been identified for essential supply chains.
Safety and Health
- For continuing operations, the all-injury frequency rate ("AIFR") as at March 31, 2021 was 2.36 and the total recordable injury frequency rate ("TRIFR") was 0.51, based on a 12-month rolling average per million hours worked. This compares favorably to the continuing operations AIFR of 4.05 and TRIFR of 0.70 at March 31, 2020.
At The Market Equity Program
- On October 28, 2020, the Company entered into an At The Market ("ATM") sales agreement (the "Sales Agreement") with BMO Capital Markets Corp. ("BMO") relating to Golden Star common shares. In accordance with the terms of the Sales Agreement, the Company may distribute shares of common stock having a maximum aggregate sales price of up to $50 million from time to time through BMO as agent for the distribution of shares or as principal. The proceeds from the Sales Agreement will be used for discretionary growth capital at Wassa, exploration, general corporate purposes and working capital.
- 2,628,719 shares of common stock had been sold under the Sales Agreement as at March 31, 2021, generating net proceeds of $8.6 million.
- From April 1 to May 5, 2021, a further 558,910 shares were sold, generating net proceeds of $1.8 million.
Changes to the Board of Directors
- Karen Akiwumi-Tanoh and Gerard De Hert have been put forward for election as directors of the Company at the forthcoming annual general meeting on May 6, 2021 (the "AGM"). Robert Doyle will not be standing for re-election at the AGM. Mr. Doyle's retirement is in line with Golden Star's board of directors (the "Board") mandate of a maximum term limit of 10 years for directors. Mona Quartey will replace Mr. Doyle as chair of the audit committee of the Board.
- This will mean an increase in the size of the Board to 10 directors, which will allow for a proper transition over the coming year, prior to further rotation in accordance with our policies next year when the Board is expected to go back to nine members.
- As a result of these changes, the female representation on the Board will increase to 40%, reflecting a continued commitment to inclusion and diversity throughout the Company.
Sale of Prestea - Deferred Consideration Amendment Agreement
- On March 28, 2021, the Company and its wholly owned subsidiadry, Caystar Holdings ("Caystar"), entered into an agreement (the "Amendment Agreement") with Future Global Resources Limited ("FGR") and Blue International Holdings Limited ("BIH"), to amend the sale and purchase agreement (the "SPA") for the sale by Caystar, and the purchase by FGR, of all the issued and outstanding share capital of Bogoso Holdings, the holder of 90% interest in Bogoso-Prestea.
- The staged payments that form the deferred consideration were reprofiled to allow time for FGR to complete the environmental bonding process for Prestea. The deferred consideration payments will now fall due as follows:
- The $5 million payment that was due on March 30, 2021 will now be payable by no later than May 31, 2021;
- The $10 million payment that was due to be paid on July 31, 2021 will be brought forward for payment by no later than May 31, 2021; and
- An amount of approximately $4.6 million (comprising the net working capital adjusted balancing payment of approximately $4.3 million and fees of approximately $0.3 million for services provided by Caystar to FGR pursuant to a transition agreement dated September 30, 2020) will continue to fall due by no later than July 31, 2021.
Severance Claim
- On September 15, 2020, certain employees of the Bogoso-Prestea operating entity ("GSBPL") initiated proceedings before the courts in Ghana claiming that the completion of the transaction contemplated by the SPA would trigger the termination of their existing employments, entitling them to severance payments. GSBPL retained defense legal counsel and vigorously defended the claim given no employment contracts were severed, amended or modified upon the completion of the sale transaction on September 30, 2020, and GSBPL continues to operate with existing employment contracts and contractual terms being honored.
- On February 16, 2021, the court ruled in favor of GSBPL that the plaintiffs' pleadings disclosed no reasonable cause of action. Accordingly, the plaintiffs lacked the requisite standing or capacity to institute the action. On March 26, 2021, the plaintiffs filed a notice of appeal.
RECENT EVENTS - Post Q1 2021 period end
Golden Star Oil Palm Plantations investment by Royal Gold
- On April 20, 2021, Golden Star Oil Palm Plantations Limited ("GSOPP"), a wholly-owned non-profit subsidiary of the Company, and RGLD Gold AG, a wholly-owned subsidiary of Royal Gold, Inc. ("Royal Gold"), entered into an agreement providing for Royal Gold's investment in the oil palm plantations initiative, Golden Star's award winning flagship sustainability project.
- In consideration of the long-standing relationship with the Wassa mine, and by extension the Wassa operations host communities, Royal Gold has committed to provide financial support for the activities of GSOPP that benefit the Wassa operational communities through an annual contribution of $150,000 during each of the next five years. Royal Gold made its first contribution of $150,000 to GSOPP in April 2021. The investment will be used to accelerate development of the Company's innovative sustainability initiative which is aimed at creating sustainable alternative livelihoods, bringing additional economic stimulation and a legacy of community development to the region. The proceeds will support the further development of palm oil plantations around Wassa as well as activities to grow GSOPP including assessment of downstream processing opportunities.
- GSOPP is the Company's flagship sustainability and social enterprise initiative. It develops and operates oil palm plantations in communities proximate to the Company's gold mining operations, located in the Western Region of Ghana, for the benefit of members of the host communities. The program commits to ensuring that there is zero deforestation during the creation of a high value agribusiness on former subsistence farms and land that has previously been used for mining activities. Since its inception in 2006, GSOPP has developed plantations on over 1,500 hectares of land, which support over 700 families at levels of yield three times the smallholder average in Ghana. The activities of GSOPP also align with the Company's wider sustainability goals of establishing high value post-mining land uses, self-funding re-vegetation and creation of biomass to act as a carbon sink to offset operational emissions.
2020 Corporate Responsibility Report
- The Company published its 2020 Corporate Responsibility Report on April 30, 2021. The report has been prepared in accordance with the Global Reporting Initiative Standards (Core option), the United Nations Global Compact reporting requirements, and the Sustainability Accounting Standards Board's ("SASB") Metals and Mining Sustainability Accounting Standard. The report and an ESG investor presentation are available on the Company's website at: www.gsr.com/responsibility.
- Key highlights of the report include:
- Leading practices in the management of the COVID-19 pandemic resulted in minimal impact to production and, more importantly, no lives lost to COVID-19 and limited serious health outcomes across the workforce.
- Sustained improvement in injury frequency rates across the organization was marred by a fatal incident at Prestea in March 2020.
- Wassa was recognized as the safest mine in Ghana, receiving the Best Performer in occupational health and safety at the Ghana Mining Industry Awards.
- Golden Star continues its leading practice performance in malaria prevention, with 2020 recording the lowest case rates and days lost to malaria on Company record.
- The Company achieved 100% conformance with its statutory monitoring program requirements and above 99% alignment to relevant quality standards.
- Consistent with our Inclusion and Diversity Policy launched in March 2020, the Company maintained its high rates of local content, with 99% of the workforce in Ghana being Ghanaian nationals and 59% of the workforce hailing from local host communities.
FY 2021 PRODUCTION AND COST GUIDANCE
Table 2: FY 2021 Production and Cost Guidance
|
Unit |
2021 Guidance |
|
|
Production and cost guidance |
||
|
Gold Production |
(koz) |
165-175 |
|
Cash Operating cost1 |
($/oz) |
660-700 |
|
AISC1 |
($/oz) |
1,000-1,075 |
|
Capital expenditure guidance |
($m) |
|
|
Sustaining Capital2 |
($m) |
26-28 |
|
Expansion Capital2 |
($m) |
19-22 |
|
Total Capital Expenditure |
($m) |
45-50 |
|
Capitalized exploration |
($m) |
4 |
|
Expensed exploration |
($m) |
11 |
|
Total Exploration |
($m) |
15 |
|
Total Capital and exploration expenditure |
($m) |
60-65 |
|
Notes: |
|
2. Expansion capital are those costs incurred at new operations and costs related to major projects at existing operations where these projects will materially increase production. All other costs relating to existing operations are considered sustaining capital. |
FY 2021 Production Guidance
- Wassa production guidance remains unchanged at 165-175koz in 2021, based on the following assumptions:
- The processing of low grade stockpiles is expected to continue throughout 2021 with a little under 1,000tpd of stockpiled material expected to be processed at a grade of approximately 0.6g/t. This initiative remains subject to gold prices sustaining near current levels.
- We expect mining rates for 2021 to be in excess of 4,500tpd, in line with the 4,469tpd achieved in 2020. The investment in drilling and development in 2020 and 2021 will unlock further increases in the mining rates in the future.
- Underground mined grades are expected to remain in line with the average grade achieved in 2020 and the recently updated reserve grade. The grade achieved during Q1 2021 was a little below the 2020 performance.
- The 2020 infill drilling program has resulted in 80% of the 2021 mine plan comprising of ounces from the measured resource category.
- The paste fill strength issues encountered in the recently filled test stope are expected to be resolved during Q2 2021.
Cost Guidance
- The $660/oz to $700/oz cash operating cost guidance for 2021 remains unchanged.
- The 2021 AISC guidance of $1,000-1,075 also remains unchanged. Q1 2021 performance and the higher than budgeted gold price result in an expectation of delivery of the upper half of the guidance range.
Capital Expenditure
- The capital programs at Wassa are expected to total $45m to $50m in 2021.
- Activities will focus on drilling and development.
- In order to ensure a robust balance sheet through the repayment of the 7% convertible debentures in August 2021, and to allow for a ramp up in drilling and development activities, 40% of the spend is budgeted for H1 2021 and the remaining 60% during H2 2021.
- Sustaining capital is expected to total $26m to $28m, of which;
- $16m is allocated to capitalized development
- $4m to $5m to the expansion of the tailing storage facilities
- Expansion capital is expected to total $19m to $22m, of which;
- $7m to $8m is allocated to capitalized drilling,
- $7m to ventilation infrastructure and $4m to capitalized development.
Genser Lease Liability
In accordance with IFRS 16 - Leases, the completion of the construction of the Genser Energy Ghana ("Genser") thermal power plant resulted in the inclusion of a non-cash $33.5 million right-to-use asset addition to property, plant and equipment and the recognition of a corresponding lease liability during Q1 2021. An element of the cost of power supplied by the Genser plant is accounted for as depreciation of the capital asset and as a finance cost. Approximately $20/oz of the power cost is not being allocated to cash operating costs or AISC in comparison with 2020.
2021 Exploration Budget
- A $15m exploration budget has been approved for 2021 which will be invested as follows:
- $7m will be invested in and around the Wassa mine. This work will include the continued wide spaced drilling up-dip and down-dip of the current resources and reserves as well as drill testing of seven targets to the south and east of the main Wassa deposit.
- The balance of the budget was expected to be allocated to the regional exploration program. This is currently being reviewed following the in-mine drilling success achieved through Q4 2020 and Q1 2021 which could result in some of the regional exploration budget being reallocated to further drilling of these in-mine targets.
SUMMARY OF CONSOLIDATED OPERATIONAL RESULTS – Q1 2021
Wassa Operational Overview
Gold production from Wassa was 40.1koz in Q1 2021, in line with the 40.3koz produced during Q1 2020. Higher processing volumes were driven by the processing of low-grade stockpile tonnes which impacted on overall processed grade.
Recovery
The recovery was 95.3% for Q4 2021, remaining consistent with Q1 2020, despite the increase in the volume of low grade stockpiles processed which resulted in a 13% reduction in the blended grade processed.
Wassa Underground
Wassa Underground produced 36.9koz of gold (approximately 92% of Wassa's total production) in the first quarter of 2021, compared to the 39.9koz produced in Q1 2020. Wassa Underground mining rates averaged 4,499tpd in Q1 2021, 4% higher than the mining rate of 4,324tpd achieved in Q1 2020 and 8% higher than 4,175tpd in Q4 2020.
The underground grade averaged 2.96g/t during the quarter, slightly higher than Q1 2020 and broadly in line with the reserve grade.
Wassa Main Pit/Stockpiles
Low grade stockpiles from the Wassa main pit of 119.1kt with an average grade of 0.71 g/t were blended with the Wassa Underground ore during Q1 2021 and yielded 3.2koz of gold, compared to 0.5koz in Q1 2020. There has been no material impact on recoveries and the Company will continue to opportunistically process low grade stockpiles in 2021 should the current gold price environment continue.
Unit costs
The unit cost performance remained robust during Q1 2021. The mining unit cost of $33.2/t of ore mined was 4% higher than in Q1 2020 and in line with Q4 2020 performance. Higher plant throughput benefited processing costs which totaled $17.2/t of ore processed, 13% lower than the $19.7/t achieved in Q1 2020 and 19% lower than Q4 2020.
Costs per ounce
Cost of sales per ounce increased 17% to $994/oz in Q1 2021, relative to Q1 2020, due to increased mine operating costs, royalties and depreciation costs and a reduction in operating costs to metal inventory credit partly offset by higher gold ounces sold.
Cash operating cost per ounce increased 14% to $718 for Q1 2021 compared to Q1 2020 mainly due to:
- higher processing costs associated with increased plant throughput from low grade stockpiles
- higher labor costs driven by year-on-year inflationary increases
- increased maintenance on drill rigs, haul trucks and processing plant
The above increases were in part offset by an increased sold ounce base relative to Q1 2020.
AISC per ounce increased 15% to $1,100 in Q1 2021 compared to Q1 2020 due to a combination of:
- increased cash operating costs as outlined above
- increased royalties resulting from the higher prevailing gold price
- higher sustaining capital expenditure
The above factors were also offset by the higher gold sales.
Projects update
- The instability of the grid power supply that caused operational challenges during H2 2020 has now largely been addressed by the commissioning of the Genser power plant. This captive supply significantly reduced the reliance on grid power during the quarter and provided the operation with a stable supply at an attractive power cost, following the successful commissioning towards the end of January.
- Paste fill plant commissioning continued during Q1 2021 including underground infrastructure, reticulation system, dump valve and shotcreting equipment and batch plant. Some commissioning delays were experienced during the quarter, including impacts of the Covid-19 pandemic, with the commissioning team required to isolate for two weeks due to positive cases and contact tracing. The plant is performing to design, however, some results of quality assurance testing returned lower than expected fill strengths in the test stope, which is currently under investigation. Test work will continue into Q2 2021 and at this point in time this delay is not expected to impact on the 2021 guidance. With secondary stopes planned in H2 2021, contingency plans are also being developed in the event of further delays to the filling schedule.
Capital expenditures
- Capital expenditures for Q1 2021 totaled $9.6m, in line with expenditure in Q1 2020. The Wassa management team continued to focus its efforts on critical development spend in order to support the medium-term growth of the underground operation including:
- sustaining capital on capitalized underground development activities of $3.1m
- expansion of the TSF of $2.0m
- growth capital on exploration drilling of $1.4m related primarily to Wassa up-dip and down-dip extensions
- development costs for increased future production of $0.9m
- infill drilling of the PEA areas from 570 Level ("570 DDD") of $0.7m
Wassa underground drillingDuring Q1 2021, the Wassa underground drilling program totaled 14,440 metres for a total cost (drilling and assay) of $1.9m. Three underground rigs focussed on converting existing indicated resources to measured resources inside the mine, while two rigs focussed on inferred to indicated resource conversion south of the existing measured and indicated resources, in the PEA area. This drill program is separate to the exploration budget and flows through the operating costs and capital investing activities.
- Resource infill drilling - During Q1 2021, the program focussed on conversion of indicated resources to measured resources, with a total of 8,590 metres drilled for a total cost of $1.1m. This program is expensed and is expected to total 33,500 metres during 2021 for a budget of $4.2m.
- Infill drilling of the Southern Extensions (PEA mining areas) - During Q1 2021, the program focused on conversion of inferred resources to indicated resources in Panel 4. Drilling totaled 5,850 metres for a cost of $0.7m. This program is capitalized and is expected to total 38,600 metres during 2021, for a total program cost of $5.3m. This drilling takes place from the 570 diamond drill decline.
EXPLORATION
During Q1 2021, $2.2 million was invested in exploration at Wassa and the regional HBB licenses, of which $1.4m of Wassa in-mine exploration was capitalized and the remaining balance was expensed. The 2021 exploration budget totals $15m, of which $4m is expected to be capitalized and $11m expensed.
Wassa – In-mine exploration
During Q1 2021, two surface drill rigs continued the testing of targets up-dip and down-dip of the existing Wassa reserve. Following on from the five holes and 3,417 meters drilled during Q4 2020, a total of nine holes were completed for 6,348 meters during Q1 2021. The initial up-dip and down-dip program is expected to total 10,000 metres in 2021.
The following table presents a summary of the results of exploration drilling at Wassa during Q1 2021:
Table 3: Q1 2021 Exploration Drilling Results Identify Extensions of the Wassa Underground Mineralization
|
Hole ID |
Azimuth |
Dip |
From |
To |
Drilled Width |
Estimated |
Grade Au |
Drilling |
|
BSDD20-006 |
89.1 |
-55.7 |
240.0 |
243.0 |
3.0 |
2.6 |
1.7 |
Up-dip |
|
BSDD20-006 |
88.8 |
-54.2 |
494.0 |
497.0 |
3.0 |
2.1 |
2.2 |
Up-dip |
|
BSDD20-006 |
89.0 |
-53.7 |
507.0 |
519.0 |
12.0 |
8.5 |
1.17 |
Up-dip |
|
BSDD21-005D1 |
83.7 |
-71.3 |
456.0 |
463.0 |
7.0 |
5.7 |
1.72 |
Down-dip |
|
BSDD21-005D1 |
79.4 |
-72.0 |
522.0 |
527.0 |
5.0 |
3.7 |
4.63 |
Down-dip |
|
BSDD21-001 |
No Significant Intersections |
Up-dip |
||||||
|
BSDD21-002 |
95.0 |
-61.2 |
386.0 |
409.0 |
23.0 |
17.0 |
3.66 |
Down-dip |
|
Including |
95.0 |
-61.2 |
394.0 |
397.0 |
3.0 |
2.2 |
11.92 |
Down-dip |
|
Including |
95.1 |
-61.1 |
402.0 |
406.0 |
4.0 |
3.0 |
4.78 |
Down-dip |
|
BSDD21-003 |
91.0 |
-58.8 |
206.0 |
213.2 |
7.2 |
5.5 |
2.78 |
Up-dip |
|
BSDD21-003 |
90.7 |
-58.4 |
248.0 |
252.0 |
4.0 |
3.4 |
1.81 |
Up-dip |
|
BSDD21-003 |
91.4 |
-57.8 |
301.5 |
305.5 |
4.0 |
3.3 |
3.53 |
Up-dip |
|
BSDD21-004 |
81.5 |
-70.4 |
702.0 |
704.0 |
2.0 |
1.5 |
6.78 |
Down-dip |
|
BSDD21-004 |
83.0 |
-70.5 |
792.2 |
799.2 |
7.0 |
5.8 |
3.8 |
Down-dip |
|
BSDD21-005 |
76.9 |
-73.9 |
74.0 |
76.0 |
2.0 |
1.8 |
9.74 |
Down-dip |
|
BSDD21-005 |
75.4 |
-74.4 |
153.7 |
156.0 |
2.3 |
1.8 |
13.3 |
Down-dip |
|
BSDD21-006 |
86.6 |
-67.7 |
581.0 |
587.0 |
6.0 |
3.6 |
1.8 |
Down-dip |
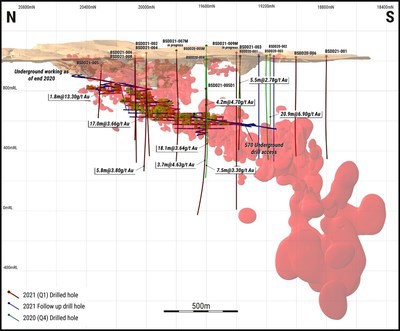
The up-dip drilling, testing the extensions of gold mineralization above the existing and planned mining stopes, was completed during the quarter. The results include the following highlights:
- BSDD21-003 (up-dip) intercepting 5.5 metres at 2.8g/t, 3.4 metres at 1.8g/t and 3.3 metres at 3.5g/t. These mineralized intercepts are c.150 metres up-dip of the previous surface drilling which has intercepted similar widths and grades.
Down-dip drilling is expected to continue in Q2 2021. The results gathered during Q1 2021 included the following highlights:
- BSDD21-002 (down-dip) intercepting 17 metres at 3.7g/t which is an isolated hanging wall zone of mineralization which will require further follow up drilling.
- BSDD21-004 (down-dip) intercepting 5.8 metres at 3.8g/t, which was drilled c.150 metres below BSDD21-002, on section 20000N, did not intersect the HW zone but did intercept the projected extension of the main B Shoot mineralization c.300 metres below the current reserve. This hole is important in that it demonstrates that the B Shoot mineralization extends below the current reserve therefore warranting further drilling in this area.
- BSDD21-005D1 (down-dip) intercepting 3.7 metres at 4.6 g/t c.150 metres down dip of BSDD20-005M which intersected 18.1 metres grading 3.6 g/t , c.65 metres below the existing reserve which now extends this mineralization over 200 metres below the current planned stoping. Further infill drilling will be evaluated upon completion of all of the down dip drilling in Q2 2021.
Exploration programs for Q2 2021 will continue testing the down-dip extensions of mineralization. Once the drilling down-dip below the existing reserve has been completed, follow-up drilling will be conducted to further test significant up-dip intersections, reducing the 200 metres spacing of this initial program to 50 metres. This tighter drill spacing has been planned around the significant intersection on section 19200N, BSDD20-003 which intersected 20.9 metres grading 6.9 g/t. Should the closer drill spacing on this target continue to intersect significant widths and grades then additional resources, close to the existing underground infrastructure, could be added.
Wassa – Near-mine exploration
The diamond and reverse circulation drill testing of seven additional targets outside of the main Wassa deposit will commence in Q2 2021. In addition to the reverse circulation and diamond drilling on other targets, initial air core drilling of a soil anomaly south east of the Wassa trend will be conducted.
HBB – Regional exploration
Exploration work testing 11 prioritized targets along the HBB trend commenced in Q1 2021. Community sensitization and crop compensation commenced on two of the southern targets. Air core drill pads were constructed at the Seikrom target in preparation of the rig arrival in Q2 2021. In addition to drill pad and access construction, line cutting ahead of the ground geophysics programs commenced. The geophysics crews are scheduled to arrive in Q2 2021.
FINANCIAL PERFORMANCE SUMMARY
Please see the separate financial statements and management's discussion and analysis for the detailed discussion on the financial results for the three months ended March 31, 2021.
Table 4 – Financial Performance Summary (continuing operations) - Three months ended March 31, 2021
|
1. See "Non-GAAP Financial Measures" |
Q1 |
Q1 2020 |
% change |
|
|
Realized gold price - spot sales |
$/oz |
1,780 |
1,612 |
10% |
|
Realized gold price - Streaming agreement1 |
$/oz |
784 |
628 |
25% |
|
Realized gold price – Consolidated |
$/oz |
1,669 |
1,481 |
13% |
|
Gold revenues |
$m |
65.0 |
54.1 |
20% |
|
Cost of sales |
$m |
31.4 |
26.0 |
21% |
|
Depreciation and amortization |
$m |
7.3 |
5.1 |
43% |
|
Mine operating profit |
$m |
26.3 |
23.0 |
14% |
|
Corporate general and administrative expense |
$m |
5.0 |
5.2 |
(4)% |
|
Exploration expense |
$m |
0.8 |
0.7 |
14% |
|
Share based compensation expense |
$m |
0.6 |
0.9 |
(33)% |
|
Other expenses |
$m |
2.9 |
0.6 |
383% |
|
Gain on fair value of derivative financial instruments, net |
$m |
(7.2) |
(4.1) |
76% |
|
Income before finance and tax |
$m |
24.3 |
19.6 |
24% |
|
EBITDA |
$m |
31.6 |
24.7 |
28% |
|
Adj. EBITDA |
$m |
27.2 |
21.2 |
28% |
|
Finance Expense |
$m |
3.7 |
3.6 |
3% |
|
Tax expense |
$m |
9.7 |
8.2 |
18% |
|
Net income |
$m |
10.8 |
7.7 |
40% |
|
Net income per share |
$/share |
0.08 |
0.06 |
33% |
|
Adj. income per share attributable to shareholders - basic1 |
$/share |
0.04 |
0.02 |
100% |
|
Cash provided by operations before working capital |
$m |
23.3 |
17.1 |
36% |
|
Changes in working capital and taxes paid |
$m |
(13.0) |
(9.6) |
(36)% |
|
Net cash used in investing activities |
$m |
(12.8) |
(12.4) |
3% |
|
Net cash provided by financing activities |
$m |
7.7 |
0.1 |
7,600% |
|
Free cash flow |
$m |
(2.5) |
(4.9) |
49% |
|
Notes: |
Discussion on Q1 2021 Financials
- Realized gold price - Including the unwinding of the deferred revenue from the streaming agreement with RGLD Gold AG, the realized gold price averaged $1,669/oz. The realized gold price for spot sales of $1,780/oz in Q1 2021 compared favorably to the $1,612/oz achieved in Q1 2020.
- Revenue totaled $65m in Q1 2021, 20% higher than $54.1m in Q1 2020 due to a 13% increase in the average realized gold price and a 7% increase in gold ounces sold.
- Depreciation increased to $7.3m during the quarter as a result of the higher capital base attributable to the completion of the infrastructure projects at the end of FY 2020, which included the paste fill plant. Depreciation is expected to continue at this elevated level and increase in line with the production rate.
- Corporate general and administrative expense amounted to $5m in Q1 2021, a 4% decrease compared to $5.2m.
- Gain on fair value of derivative financial liabilities totaled $7.2m during Q1 2021, this included:
- Hedging - During Q1 2021, a number of the original hedge contracts matured with no realized losses associated with the contracts during Q4 2020, however, the Company recognized an unrealized gain of $4.8m during the quarter. At the end of Q1 2021, the outstanding zero cost collars totaled 76.6koz with a floor price of $1,600/oz and a ceiling of $2,176/oz in 2021 and $2,188/oz in 2022. These positions mature at a rate of 10.9koz per quarter to December 2022.
- 7% Convertible debentures - The fair value of the convertible derivative reduced by $2.4m during the quarter. The convertibles mature in August 2021 and the Company intends to repay the facility using its current cash and available liquidity.
- EBITDA from continuing operations amounted to $31.6m for Q1 2021, 28% higher than the $24.7m achieved in Q1 2020 as a result of the increased gold price and higher gold sales.
- Adjusted EBITDA totaled $27.2m, representing a 28% increase on the $21.2m achieved in Q1 2020. The adjustments applied include:
- The gain on fair value of financial instruments of $(7.2)m (Q1 2020 - $(4.1)m)
- Other expenses of $2.9m (Q1 2020 - $0.6m)
- Adjusted net income attributable to Golden Star shareholders (see "Non-GAAP Financial Measures" section) was $4.4m or $0.04 basic income per share in Q1 2021 compared to $2.2m or $0.02 basic income per share in Q1 2020. This was impacted by the higher depreciation charge and gold sales being lower than production during the quarter. Adjusted net income attributable to Golden Star shareholders reflects adjustments for non-recurring and abnormal items which are mostly non-cash in nature, including:
- The gain on fair value of financial instruments of $(7.2)m
- Other expenses of $0.5m
- Loss allowance on deferred consideration on the sale of Prestea $2.1m
- Working capital and taxes paid - The working capital balances were neutral during Q1 2021 with a change of $0.1m. $13.2m of income tax liabilities, relating to Q4 2020, were paid during the quarter.
- Investing activities - Net cash used in investing activities totaled $12.8m which includes the following cash flows:
- Additions to mining interests $9.8m
- Change in accounts payable and deposits on mine equipment and material $2.8m which is largely the payment of capital investments accrued for in Q4 2020
- Net cash from financing activities totaled $7.7m. This includes the $8.6m of net proceeds from the ATM program received during the quarter.
- Free cash flow - During Q1 2021, continuing operations incurred a free cash outflow of $2.5m as a result of gold sales being 1.2koz lower than production, significant capital investment during the quarter and the $13.2m tax payment relating to Q4 2020.
Financial position
The Company held $66.1m of cash and cash equivalents and $105.6m of debt, for net debt of $39.5m as at March 31, 2021. The net debt position improved by $3.9m during Q1 2021 primarily as a result of the $5.3m increase in the cash position following the use of the ATM program during the quarter. The table below summarizes the financial position of the Company:
Table 5 – Financial Position - Three months ended March 31, 2021
|
Q1 2021 |
Q1 2020 |
% change |
||
|
Summary of debt facilities |
||||
|
Macquarie Credit Facility |
$m |
55.1 |
57.7 |
(5)% |
|
Convertible Debentures |
$m |
50.5 |
47.6 |
6% |
|
Gross Debt Position |
$m |
105.6 |
105.3 |
- |
|
Cash Position |
$m |
66.1 |
41.9 |
58% |
|
Net Debt |
$m |
39.5 |
63.4 |
(38)% |
Company Profile:
Golden Star is an established gold mining company that owns and operates the Wassa underground mine in Ghana, West Africa. Listed on the NYSE American, the Toronto Stock Exchange and the Ghana Stock Exchange, Golden Star is focused on delivering strong margins and free cash flow from the Wassa mine. As the winner of the Prospectors & Developers Association of Canada 2018 Environmental and Social Responsibility Award, Golden Star remains committed to leaving a positive and sustainable legacy in its areas of operation
Statements Regarding Forward-Looking Information
Some statements contained in this news release are "forward-looking statements" within the meaning of the Private Securities Litigation Reform Act of 1995 and "forward looking information" within the meaning of Canadian securities laws. Forward looking statements and information include but are not limited to, statements and information regarding: present and future business strategies and the environment in which Golden Star will operate in the future, including the price of gold, anticipated costs and ability to achieve goals; gold production, cash operating costs, AISC and capital expenditure estimates and guidance for 2021, and the Company's achievement thereof; the sources of gold production at Wassa during 2021; the processing of low grade stockpiles at Wassa for the remainder of the year; expected grade and mining rates for 2021; the ability to improve recovery; the ability to achieve production growth; the ability to improve cash generation; the ability to increase the size of the Wassa ore body; the commissioning of the paste fill plant project and timing thereof; the improvements to be realized through the delivery of a range of operational initiatives; the ability to improve the scale of operations and margin at Wassa; the expected allocation of the Company's capital expenditures; implementation of the Company's exploration programs and the timing thereof; the anticipated exploration activities for 2021; the ability to expand the Company and its production profile through exploration and development activities; the potential impact of the COVID-19 pandemic on the Company's operations and the ability to mitigate such impact; the securing of adequate supply chains for key consumables; the ability to continue to ship gold across borders and to refine doré at the South African refinery; the receipt by Golden Star of the deferred consideration from the sale of Bogoso-Prestea, and the potential amount and timing thereof; the anticipated effectiveness of the hedging program over the next 12 months; and the Company having sufficient cash available to support its operations and mandatory expenditures for the next twelve months. Generally, forward-looking information and statements can be identified by the use of forward-looking terminology such as "plans", "expects", "is expected", "budget", "scheduled", "estimates", "forecasts", "intends", "anticipates", "believes" or variations of such words and phrases (including negative or grammatical variations) or statements that certain actions, events or results "may", "could", "would", "might" or "will be taken", "occur" or "be achieved" or the negative connotation thereof. Investors are cautioned that forward-looking statements and information are inherently uncertain and involve risks, assumptions and uncertainties that could cause actual facts to differ materially. Such statements and information are based on numerous assumptions regarding present and future business strategies and the environment in which Golden Star will operate in the future. Forward-looking information and statements are subject to known and unknown risks, uncertainties and other important factors that may cause the actual results, performance or achievements of Golden Star to be materially different from those expressed or implied by such forward-looking information and statements, including but not limited to: gold price volatility; discrepancies between actual and estimated production; mineral reserves and resources and metallurgical recoveries; mining operational and development risks; liquidity risks; suppliers suspending or denying delivery of products or services; regulatory restrictions (including environmental regulatory restrictions and liability); actions by governmental authorities; the speculative nature of gold exploration; ore type; the global economic climate; share price volatility; the availability of capital on reasonable terms or at all; risks related to international operations, including economic and political instability in foreign jurisdictions in which Golden Star operates; risks related to current global financial conditions; actual results of current exploration activities; environmental risks; future prices of gold; possible variations in mineral reserves and mineral resources, grade or recovery rates; mine development and operating risks; an inability to obtain power for operations on favourable terms or at all; mining plant or equipment breakdowns or failures; an inability to obtain products or services for operations or mine development from vendors and suppliers on reasonable terms, including pricing, or at all; public health pandemics such as COVID-19, including risks associated with reliance on suppliers, the cost, scheduling and timing of gold shipments, uncertainties relating to its ultimate spread, severity and duration, and related adverse effects on the global economy and financial markets; accidents, labor disputes and other risks of the mining industry; delays in obtaining governmental approvals or financing or in the completion of development or construction activities; litigation risks; and risks related to indebtedness and the service of such indebtedness. Although Golden Star has attempted to identify important factors that could cause actual results to differ materially from those contained in forward-looking information and statements, there may be other factors that cause results not to be as anticipated, estimated or intended. There can be no assurance that future developments affecting the Company will be those anticipated by management. Please refer to the discussion of these and other factors in management's discussion and analysis of financial conditions and results of operations for the year ended December 31, 2020, and in our annual information form for the year ended December 31, 2019 as filed on SEDAR at www.sedar.com. The forecasts contained in this press release constitute management's current estimates, as of the date of this press release, with respect to the matters covered thereby. We expect that these estimates will change as new information is received. While we may elect to update these estimates at any time, we do not undertake any estimate at any particular time or in response to any particular event.
Non-GAAP Financial Measures
In this press release, we use the terms "cash operating cost", "cash operating cost per ounce", "all-in sustaining costs", "all-in sustaining costs per ounce", "adjusted net (loss)/income attributable to Golden Star shareholders", "adjusted (loss)/income per share attributable to Golden Star shareholders", "cash provided by operations before working capital changes", and "cash provided by operations before working capital changes per share - basic".
"Cost of sales excluding depreciation and amortization" as found in the statements of operations includes all mine-site operating costs, including the costs of mining, ore processing, maintenance, work-in-process inventory changes, mine-site overhead as well as production taxes, royalties, severance charges and by-product credits, but excludes exploration costs, property holding costs, corporate office general and administrative expenses, foreign currency gains and losses, gains and losses on asset sales, interest expense, gains and losses on derivatives, gains and losses on investments and income tax expense/benefit.
"Cost of sales per ounce" is equal to cost of sales excluding depreciation and amortization for the period plus depreciation and amortization for the period divided by the number of ounces of gold sold (excluding pre-commercial production ounces sold) during the period.
"Cash operating cost" for a period is equal to "cost of sales excluding depreciation and amortization" for the period less royalties, the cash component of metals inventory net realizable value adjustments, materials and supplies write-off and severance charges, and "cash operating cost per ounce" is that amount divided by the number of ounces of gold sold (excluding pre-commercial production ounces sold) during the period. We use cash operating cost per ounce as a key operating metric. We monitor this measure monthly, comparing each month's values to prior periods' values to detect trends that may indicate increases or decreases in operating efficiencies. We provide this measure to investors to allow them to also monitor operational efficiencies of the Company's mines. We calculate this measure for both individual operating units and on a consolidated basis. Since cash operating costs do not incorporate revenues, changes in working capital or non-operating cash costs, they are not necessarily indicative of operating profit or cash flow from operations as determined under IFRS. Changes in numerous factors including, but not limited to, mining rates, milling rates, ore grade, gold recovery, costs of labor, consumables and mine site general and administrative activities can cause these measures to increase or decrease. We believe that these measures are similar to the measures of other gold mining companies, but may not be comparable to similarly titled measures in every instance.
"All-in sustaining costs" commences with cash operating costs and then adds the cash component of metals inventory net realizable value adjustments, royalties, sustaining capital expenditures, corporate general and administrative costs (excluding share-based compensation expenses and severance charges), and accretion of rehabilitation provision. For mine site all-in sustaining costs, corporate general and administrative costs (excluding share-based compensation expenses and severance charges) are allocated based on gold sold by each operation. "All-in sustaining costs per ounce" is that amount divided by the number of ounces of gold sold (excluding pre-commercial production ounces sold) during the period. This measure seeks to represent the total costs of producing gold from current operations, and therefore it does not include capital expenditures attributable to projects or mine expansions, exploration and evaluation costs attributable to growth projects, income tax payments, interest costs or dividend payments. Consequently, this measure is not representative of all of the Company's cash expenditures. In addition, the calculation of all-in sustaining costs does not include depreciation expense as it does not reflect the impact of expenditures incurred in prior periods. Therefore, it is not indicative of the Company's overall profitability. Share-based compensation expenses are also excluded from the calculation of all-in sustaining costs as the Company believes that such expenses may not be representative of the actual payout on equity and liability based awards.
The Company believes that "all-in sustaining costs" will better meet the needs of analysts, investors and other stakeholders of the Company in understanding the costs associated with producing gold, understanding the economics of gold mining, assessing the operating performance and the Company's ability to generate free cash flow from current operations and to generate free cash flow on an overall Company basis. Due to the capital intensive nature of the industry and the long useful lives over which these items are depreciated, there can be a disconnect between net earnings calculated in accordance with IFRS and the amount of free cash flow that is being generated by a mine. In the current market environment for gold mining equities, many investors and analysts are more focused on the ability of gold mining companies to generate free cash flow from current operations, and consequently the Company believes these measures are useful non-IFRS operating metrics ("non-GAAP measures") and supplement the IFRS disclosures made by the Company. These measures are not representative of all of Golden Star's cash expenditures as they do not include income tax payments or interest costs. Non-GAAP measures are intended to provide additional information only and do not have standardized definitions under IFRS and should not be considered in isolation or as a substitute for measures of performance prepared in accordance with IFRS. These measures are not necessarily indicative of operating profit or cash flow from operations as determined under IFRS.
"Adjusted net (loss)/income attributable to Golden Star shareholders" is calculated by adjusting net (loss)/income attributable to Golden Star shareholders for (gain)/loss on fair value of financial instruments, share-based compensation expenses, severance charges, loss/(gain) on change in asset retirement obligations, deferred income tax expense, non-cash cumulative adjustment to revenue and finance costs related to the Streaming Agreement, and impairment. The Company has excluded the non-cash cumulative adjustment to revenue from adjusted net income/(loss) as the amount is non-recurring, the amount is non-cash in nature and management does not include the amount when reviewing and assessing the performance of the operations. "Adjusted (loss)/income per share attributable to Golden Star shareholders" for the period is "Adjusted net (loss)/income attributable to Golden Star shareholders" divided by the weighted average number of shares outstanding using the basic method of earnings per share.
For additional information regarding the Non-GAAP financial measures used by the Company, please refer to the heading "Non-GAAP Financial Measures" in the Company's Management Discussion and Analysis of Financial Condition and Results of Operations for the year ended December 31, 2020 and the three months ended March 31, 2021, which are available at www.sedar.com.

![]() View original content to download multimedia:http://www.prnewswire.com/news-releases/golden-star-resources-reports-results-for-the-first-quarter-2021-301284906.html
View original content to download multimedia:http://www.prnewswire.com/news-releases/golden-star-resources-reports-results-for-the-first-quarter-2021-301284906.html
SOURCE Golden Star Resources Ltd.